Title here
Summary here
June 30, 2024 by Sharjeel Aziz7 minutes
DORA (DevOps Research and Assessment) metrics serve as a crucial checklist for tech teams, helping them gauge their efficiency in software development and deployment. These metrics are derived from extensive research aimed at understanding what drives successful tech teams.
The Four Key Metrics:
These metrics come from a big study that looked at what makes tech teams successful. Although the number of metrics is low they encompass the concept of shipping quality software often and increase reliability. The metrics help teams figure out where they can get better at building and fixing their software quickly and without too many issues. You can do a quick assessment by taking the DORA quick check. Most of the data and metrics required for implementing DORA metrics are readily available in commonly used DevOps tools and implementing them can as easy following a few steps.
Implementing DORA Metrics:
Steps to Follow
Jenkins is commonly used for CI/CD by many development teams. Let’s see if we can gather DORA metrics from a Jenkins job, we can leverage the Jenkins API and extract the relevant data. If you would like to create a test Jenkins instance rather than trying this in your production instance, please refer to this repository to create a test Jenkins instance. The repository has a script for a Hello World job that fails randomly to generate data, etc.
Let’s put together a simple dashboard using Flask. This dashboard will connect to Jenkins through its API to gather build data, compute the Change Failure Rate, and then display these results on a web page. For detailed code, please check this repository.
Jenkins offers a remote access API for many of its objects, found at /.../api/, where “…” represents the specific object you want to access. For example, adding /api/json to the URL of our job lets us pull its builds in JSON format. Initially, this won’t include the results of the builds, but you can get more detailed data, including build results, by using the depth=N query parameter. To see build results, you might use a URL like http://192.168.85.235:8080/job/Hello%20World/api/json?depth=1.
You may need to look at permissions if the API is not accessible.
Configure Security Settings:
Test API Accessibility:
curl http://192.168.85.235:8080/job/Hello%20World/api/json or enter the URL directly in your web browser.The heart of our dashboard is the app.py script, which fetches and processes Jenkins build data. We use the Jenkins API to get detailed information about each build, including whether each build succeeded or failed. Here’s how we fetch the build details:
def get_builds(base_url, job_name):
    """
    Fetch builds information for a specific job using the Jenkins API with depth=1.
    """
    api_url = f"{base_url}/job/{job_name}/api/json?depth=1"
    response = requests.get(api_url)
    builds = response.json()["builds"]
    return builds
We call this function with parameters specifying the base URL of your Jenkins server and the job name. The depth=1 query parameter in the API call ensures we retrieve detailed information about each build.
Once we have the build data, we need to organize it by month and calculate the Change Failure Rate for each month:
def aggregate_data_by_month(builds):
    """
    Organize build data by month and ensure all last six months are displayed.
    """
    last_six_months = generate_last_six_months()
    data = {
        month: {"total_builds": 0, "failed_builds": 0, "rate": 0.0}
        for month in last_six_months
    }

    for build in builds:
        timestamp = build.get("timestamp",0)
        if timestamp:
            date = datetime.fromtimestamp(timestamp / 1000.0, timezone.utc)
            month = date.strftime("%Y-%m")
            if month in data:
                data[month]["total_builds"] += 1
                if build["result"] == "FAILURE":
                    data[month]["failed_builds"] += 1

    # Calculate the change failure rate for each month
    for month in data:
        total = data[month]["total_builds"]
        failed = data[month]["failed_builds"]
        data[month]["rate"] = (failed / total * 100) if total > 0 else 0

    return [{"month": month, **data[month]} for month in last_six_months]
This function organizes the build data by month and calculates the total number of builds, the number of failed builds, and the Change Failure Rate.
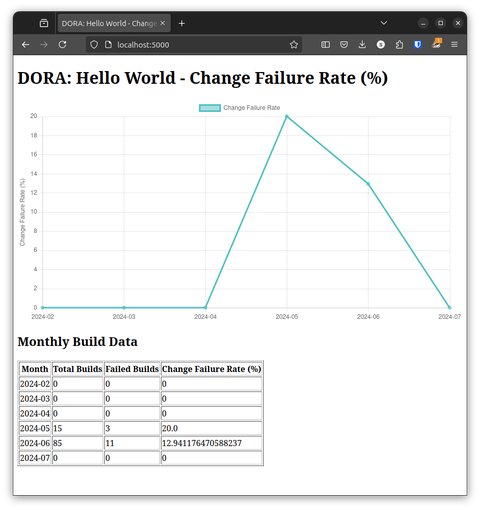
The dashboard.html template uses Chart.js to visually represent the Change Failure Rate over the last six months:
<script>
const ctx = document.getElementById('changeFailureRateChart').getContext('2d');
const changeFailureRateChart = new Chart(ctx, {
   type: 'line',
   data: {
         labels: {{ month_data | map(attribute='month') | list | tojson }},
         datasets: [{
            label: 'Change Failure Rate',
            data: {{ month_data | map(attribute='rate') | list | tojson }},
            borderColor: 'rgb(75, 192, 192)',
            backgroundColor: 'rgba(75, 192, 192, 0.5)',
            yAxisID: 'y',
         }]
   },
...
...
...
...
</script>
This script creates a line chart displaying the Change Failure Rate for each month, making it easy to track trends and identify issues. We package all this in a lightweight container for our Flask application, ensuring that all dependencies are installed and the service is ready to run. The code for the the dashboard is available in this repository.
Navigate to the metric-dashboard directory containing the Dockerfile and build the Docker image:
docker build -t jenkins-metrics-dashboard:latest .Run the Docker container to start the dashboard:
docker run --env JENKINS_BASE_URL="http://192.168.85.235:8080" --env JENKINS_JOB_NAME="Hello World" --name jenkins-metrics-dashboard -p 5000:5000 -d jenkins-metrics-dashboard:latestAfter starting the container, open your web browser and navigate to http://localhost:5000 to view your Jenkins Metrics Dashboard. You should see the Change Failure Rate and other metrics displayed based on the data fetched from Jenkins.
Remember, implementing DORA metrics requires collaboration between development, operations, and other relevant teams. It’s essential to foster a culture of continuous improvement and use the metrics to drive positive changes in your software delivery processes. Here are some ideas on how to extract other metrics.
Extract Deployment Frequency:
Extract Lead Time for Changes:
Extract Mean Time to Restore (MTTR):
Extract Change Failure Rate:
Store and Visualize Metrics:
To automate the process of gathering DORA metrics from Jenkins, you can use tools like Jenkins Pipeline or create custom scripts (e.g., using Python or Groovy) that interact with the Jenkins API and perform the necessary calculations.
Additionally, there are Jenkins plugins and third-party tools that can help with DORA metrics collection and visualization.